RESIDENTIAL MARKET REPORT 2020
Well who would have predicted in March when the market was closed that 2020 would end up being a more successful year for the whole property market than 2019, certainly not us!
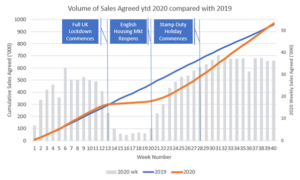
So here you have it the volume of sales agreed (SSTC’s) has now surpassed the 2019 number for the year to date with 967k SSTC’s this year so far compared to 956k in the same period 2019.
The next challenge is maintaining new stock volumes coming to the market and as we discussed in our last report getting this increased volume of agreed transactions across the completion line. A strange year to say the least!
The Headline
- The cumulative volume of Sales Agreed in 2020 year to date is larger than it was at this point in 2019.
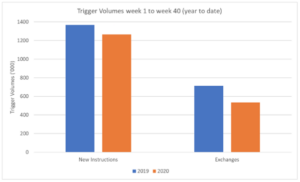
- The volumes of New Instructions in 2020 year to date is 92% of the 2019 like for like number.
- Exchanges in 2020 are currently lagging behind 2019 by 25% like for like, but watch out for big future rises.
This week, the cumulative volume of Sales Agreed in 2020 year to date has overtaken this point in 2019 – perhaps 2020 may not be so much of a bad year for the housing market and home movers after all.
Volume of Sales Agreed |
| The following chart is more complex than our usual but as it represents several insights in the same graphic it is worthwhile taking the time to digest it. |

The blue and orange lines show the cumulative volume of sales agreed and suggest the following key take-outs:
|
|
To aid the user in understanding where the demand increase was generated, we have charted the weekly sales agreed volumes with grey bars on a secondary axis. This suggests the following key take outs:
|
|
| This raises the question when are high volumes of sales agreed going to end?
The answer to this question does, right now, seem to require a crystal ball – the numbers don’t obviously show us the way here. In usual times, we would expect sales agreed will revert to “normal” demand levels when buyers believe that they can not complete on a property purchase prior to the end of the stamp duty holiday on 31st March 2021. It appears this realisation may dawn on many purchasers about the same time as the furlough scheme ends. Could this be a double blow to consumer confidence in early November? In normal times it would seem that this points to the potential for a rapid reduction in Sales Agreed before Christmas but, as we aren’t the first to say, these are far from usual times and the reactions of government has the potential to completely transform the landscape. |
|
| Volume of New Instructions and Exchanges | |
| There are two other key triggers that we need to examine prior to ending this client briefing. These are the volume of property coming to the market for sale (New Instructions) and Exchanges. The comparison from weeks 1 to 40 (year to date) between 2020 and 2019 is shown in the following chart for both metrics.
Contact us today to find out more. |
